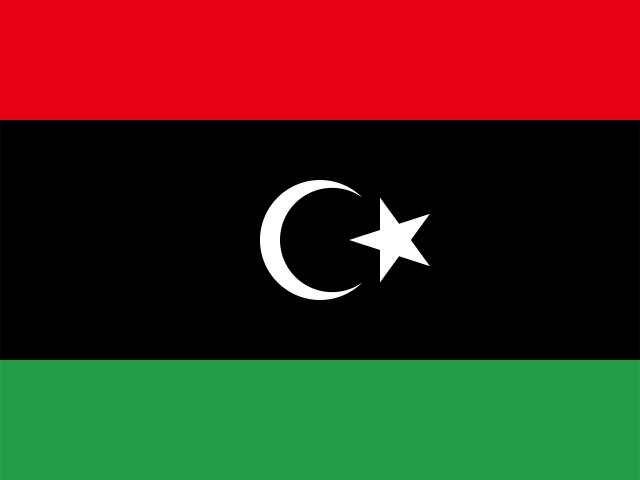
 Libya
Libya ranks #103 of 242 on the Composite Power Index (0.5/100), scored on military spending, active personnel, nuclear arsenal, economic size and logistics. Its Instability Index is 28.4/100 (#84 most fragile). Every figure below carries its source and year. Data read 2026-10-22.
Analyst briefing
Libya: Large Reserves and Hydrocarbon Output, Fractured Governance Scores
Libya's economy was valued at $48.49 billion in 2024, with per-capita output of $6,569.16, on a population of 7,381,023, per World Bank WDI figures. Foreign reserves stood at $92.89 billion in 2024, per World Bank WDI — a large figure relative to GDP that should be read in the context of Libya's hydrocarbon export base. No government-debt-to-GDP figure is available in this bundle.
Defense Posture
SIPRI Milex data put military spending at $1.57 billion in 2023, equivalent to 3.572% of GDP by SIPRI's own GDP series for that year. Active personnel are recorded at 7,000, but that figure is dated to 2015, per COW NMC — a year that falls within Libya's post-2011 conflict and institutional fragmentation, so it should be treated as a snapshot of that period rather than a current count. The composite index of national capability (CINC) is 0.0008003324 for 2022, per COW NMC, calculated on a different basis and year than the personnel figure.
Governance
V-Dem v15's 2025 scores show an electoral democracy index of 0.193, a liberal democracy index of 0.098, and a state capacity score of 0.125 — all low, consistent with Libya's fragmented governance landscape as captured by V-Dem's indicators for that year.
Energy
Libya's energy data reflect its hydrocarbon economy: primary energy consumption was 0.7773 exajoules in 2023, per Our World in Data's energy series, with electricity generation of 34.59 terawatt-hours, oil production of 648.061 terawatt-hours, and gas production of 142.593 terawatt-hours, all for 2024 from the same source.
Data Gaps
The personnel figure (7,000, 2015) predates the more recent period and may not reflect current force structure; this bundle has no later update. No government debt figure is available for Libya in this bundle. The 3.572% milex/GDP figure is tied to SIPRI's own 2023 GDP series and should not be checked against the World Bank's $48.49 billion 2024 GDP figure, a different year and series. Given Libya's recent conflict history, any of these figures may predate or straddle periods of instability and should be read with that caveat rather than assumed to describe a stable baseline.
Sources: World Bank WDI, SIPRI Milex, COW NMC, V-Dem v15, Our World in Data (Energy).
Written from the sourced figures on this page and checked against them before publication — any figure not present in the data blocks the briefing. Generated 2026-10-06.
What drives the instability score
Capability and economy · click a metric to compare
CINC is a composite index (already contains military spending, personnel, energy & population) — shown for reference; it is not added into the Composite Power Index to avoid double-counting. Each figure carries its own source year; vintages can differ.
Capability profile
Trajectory
Governance
Energy
Strategic Relationships
Allies (26)
- Moroccodefense 1989
- Mauritaniadefense 1989
- Tunisiadefense 1989
- Algeriadefense 1989
- Ethiopiadefense 1981
- Syriadefense 1980
- Nigerdefense 1974
- Saudi Arabiadefense 1964
- Sudandefense 1964
- Iraqdefense 1964
- Jordandefense 1964
- Lebanondefense 1964
- United Kingdomdefense 1953
- Yemennonaggression 1990
COW alliance ties — includes historical pacts; defense first.
Disputes (89)
COW Dyadic MID, 1816–2014 — historical register, not live rivalries. Count = militarized disputes; year = most recent; ● = peak intensity.
- United States14× · 2011
- France7× · 2011
- Tunisia5× · 2011
- Italy2× · 2011
- Lithuania1× · 2011
- Slovakia1× · 2011
- Qatar1× · 2011
- Slovenia1× · 2011
- Luxembourg1× · 2011
- Sweden1× · 2011
- Romania1× · 2011
- Montenegro1× · 2011
Signals
Conflict forecast (ViEWS, 2029-04-01): 0% risk
Arms imports (SIPRI Arms Transfers, 2024): 1 transfers
Displacement (UNHCR): 17.2K refugees originated · 32.8K IDPs · 552.5K hosted
 Algeria
 Egypt
 Greece
 Italy
 Malta