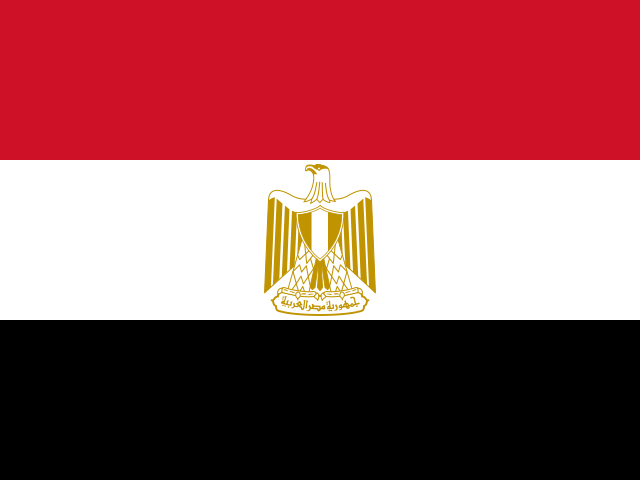
 Egypt
Egypt ranks #23 of 242 on the Composite Power Index (5.5/100), scored on military spending, active personnel, nuclear arsenal, economic size and logistics. Its Instability Index is 34/100 (#57 most fragile). Every figure below carries its source and year. Data read 2026-10-22.
Analyst briefing
Egypt: High Debt Load Alongside Large Standing Military
Egypt's economy was valued at $389.1 billion in 2024, per the World Bank's WDI data, with GDP per capita of $3,338 the same year across a population of 116.5 million. Government debt is projected by the IMF's World Economic Outlook at 87.0 percent of GDP for 2026 — a high ratio that, read against reserves of $30.7 billion in 2025 (IMF IFS), points to a comparatively thin external buffer against the debt stock.
Military Spending and Capacity
SIPRI's 2025 figures place Egyptian military spending at $2.5 billion, equal to 0.606 percent of GDP under SIPRI's own GDP series — a ratio that should not be recomputed against the World Bank's GDP figure, since the two series diverge. That spending level sits alongside a large standing force: the Correlates of War National Material Capabilities dataset counted 439,000 active personnel in 2022, among the larger forces in the region by headcount, with a CINC score of 0.0118 the same year. Both the personnel and CINC figures are three years older than the 2025 spending data.
Governance
V-Dem's 2025 data score Egypt's electoral democracy index at 0.187 and liberal democracy index at 0.115 — both low, indicating limited competitive elections and weak constraints on executive authority. State capacity scores considerably higher at 0.321, suggesting the state's administrative reach exceeds its democratic openness.
Energy
Egypt consumed 4.0531 exajoules of primary energy in 2024, per Our World in Data. Electricity generation was 245.71 TWh, but that figure is dated 2025, one year later than the primary energy, oil and gas figures (all 2024) — the data are not drawn from a single reporting year and should be read with that mismatch in mind. Oil production was 362.153 TWh and gas production 475.192 TWh in 2024, with gas output moderately exceeding oil in energy terms.
Data Gaps
No more recent personnel or CINC figures beyond 2022 are available in this record, and no nuclear or alliance data are present. The debt figure is an IMF projection for the current year rather than an outturn, and should be treated as such. Taken together, the reserves-to-debt relationship and the low liberal-democracy score are the two figures most worth flagging for analysts assessing Egypt's near-term stability from this dataset alone.
Sources: World Bank WDI, IMF WEO, IMF IFS, SIPRI Milex, COW NMC, V-Dem v15, Our World in Data (Energy)
Written from the sourced figures on this page and checked against them before publication — any figure not present in the data blocks the briefing. Generated 2026-10-06.
What drives the instability score
Capability and economy · click a metric to compare
CINC is a composite index (already contains military spending, personnel, energy & population) — shown for reference; it is not added into the Composite Power Index to avoid double-counting. Each figure carries its own source year; vintages can differ.
Capability profile
Trajectory
Governance
Energy
Strategic Relationships
Allies (28)
- Francedefense 1937
- Greecedefense 1937
- Romaniadefense 1937
- Serbiadefense 1937
- Türkiyedefense 1937
- Bulgariadefense 1937
- Israelnonaggression 2012
- Yemennonaggression 1990
- Iraqnonaggression 1989
- Jordannonaggression 1989
- Kuwaitnonaggression 1989
- Lebanonnonaggression 1989
- Libyanonaggression 1989
- Moroccononaggression 1989
COW alliance ties — includes historical pacts; defense first.
Disputes (96)
COW Dyadic MID, 1816–2014 — historical register, not live rivalries. Count = militarized disputes; year = most recent; ● = peak intensity.
Signals
Conflict forecast (ViEWS, 2029-04-01): 0% risk
Arms imports (SIPRI Arms Transfers, 2025): 1 transfers
31% of imports from United States — supplier dependence
Displacement (UNHCR): 23.8K refugees originated · 0 IDPs · 220K hosted
 Cyprus
 Greece
 Iraq
 Israel
 Jordan