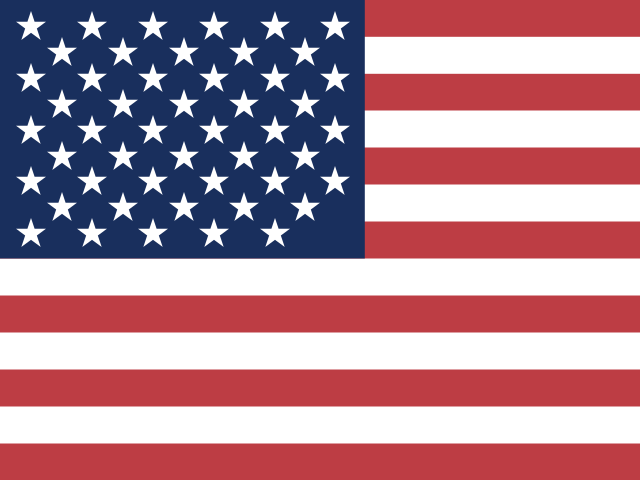
 United States
 ranks #1 of 242 on the Composite Power Index (93.7/100), scored on military spending, active personnel, nuclear arsenal, economic size and logistics. Its Instability Index is 20.5/100 (#128 most fragile). Every figure below carries its source and year. Data read 2026-10-22.
Analyst briefing
United States: Unmatched Spending, Strained Balance Sheet
Economic base
World Bank WDI data put US gross domestic product at roughly $28.8 trillion in 2024, spread across a population of about 340.1 million that year — some $84,534 per head. That income base underwrites the country's global military posture, but the public finances behind it are heavily leveraged: IMF World Economic Outlook figures show general government debt at 125.8 percent of GDP in 2026.
Official reserve assets are small against that economy. IMF International Financial Statistics report $243.3 billion in 2025, well under 1 percent of the 2024 GDP figure above. For an issuer of the principal reserve currency, low reserves reflect how the system works rather than a liquidity problem, though the supplied data contain no current-account, external-debt or exchange-rate series with which to test that reading.
Military weight
SIPRI's 2025 figures record US military expenditure of $954.4 billion, equal to 3.117 percent of GDP on SIPRI's own national-accounts series. That share should not be recalculated against the 2024 World Bank GDP figure cited above; the two series are differently dated and differently constructed.
Manpower data are considerably older. The Correlates of War National Material Capabilities dataset records 1.36 million active personnel in 2022, with a Composite Index of National Capability score of 0.1236 for the same year. No post-2022 personnel count is supplied, leaving a three-year gap between the spending and manpower pictures — relevant because recruitment and force structure can move substantially over that span.
The FAS Nuclear Notebook puts the US warhead inventory at 5,177 in 2025. The supplied data give no breakdown into deployed, reserve and awaiting-dismantlement stocks, so the figure should be read as a total inventory rather than as fielded capability.
Governance
V-Dem v15 scores for 2025 show electoral democracy at 0.735 and liberal democracy at 0.571 on a zero-to-one scale. The liberal score sits markedly below the electoral one, indicating that constraints on executive power and rule-of-law protections are rated weaker than the conduct of elections themselves. State capacity is scored 0.924, among the higher end of the index range, pointing to an administrative apparatus that remains effective.
Energy
Our World in Data records 95.5 exajoules of US primary energy consumption in 2024 and 4,519.79 terawatt-hours of electricity in 2025. Domestic hydrocarbon output is substantial on the same source's 2024 figures: 9,977.4 TWh of oil and 10,330.0 TWh of gas. The dataset supplies no import, export or net-balance figures, so self-sufficiency cannot be assessed from these numbers alone.
Data gaps
Nothing here covers trade exposure, alliance commitments, defense-industrial output or conflict events. Any judgment on those dimensions would require data not in this file.
Sources: World Bank WDI, IMF WEO, IMF IFS, SIPRI Military Expenditure Database, COW National Material Capabilities, FAS Nuclear Notebook, V-Dem v15, Our World in Data (Energy).
Written from the sourced figures on this page and checked against them before publication — any figure not present in the data blocks the briefing. Generated 2026-10-06.
What drives the instability score
Capability and economy · click a metric to compare
CINC is a composite index (already contains military spending, personnel, energy & population) — shown for reference; it is not added into the Composite Power Index to avoid double-counting. Each figure carries its own source year; vintages can differ.
Capability profile
Trajectory
Governance
Energy
Strategic Relationships
Allies (69)
- Czechiadefense 1999
- Hungarydefense 1999
- Polanddefense 1999
- Belizedefense 1991
- Guyanadefense 1991
- Germanydefense 1990
- Canadadefense 1989
- St. Kitts and Nevisdefense 1984
- Bahamasdefense 1982
- St. Vincent and the Grenadinesdefense 1981
- Antigua and Barbudadefense 1981
- Spaindefense 1981
- Dominicadefense 1979
- St. Luciadefense 1979
COW alliance ties — includes historical pacts; defense first.
Disputes (381)
COW Dyadic MID, 1816–2014 — historical register, not live rivalries. Count = militarized disputes; year = most recent; ● = peak intensity.
- Russia58× · 2014
- China39× · 2014
- North Korea24× · 2014
- Pakistan9× · 2014
- Syria8× · 2014
- Afghanistan3× · 2014
- Iran18× · 2013
- Libya14× · 2011
- Venezuela2× · 2010
- Somalia1× · 2008
- Côte d'Ivoire1× · 2004
- Iraq12× · 2003
Signals
Conflict forecast (ViEWS, 2029-04-01): 0% risk
Arms imports (SIPRI Arms Transfers, 2025): 11 transfers
22% of imports from Israel — supplier dependence
Displacement (UNHCR): 3.7K refugees originated · 0 IDPs · 457.6K hosted
 Bahamas
 Canada
 Cuba
 Mexico
 Russia