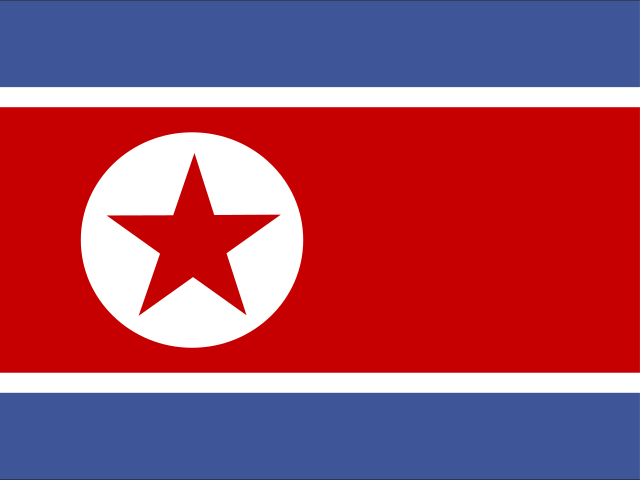
 North Korea
 ranks #5 of 242 on the Composite Power Index (12.4/100), scored on military spending, active personnel, nuclear arsenal, economic size and logistics. Its Instability Index is 26.3/100 (#98 most fragile). Every figure below carries its source and year. Data read 2026-10-22.
Analyst briefing
North Korea: Mass Mobilization, Measured Through Gaps
This briefing is short by design. The dataset for North Korea is sparse, and the honest account of it is correspondingly limited. Readers should treat the absences below as findings in their own right.
What the data shows
The population figure is current: 26.5 million in 2024, per World Bank WDI. Against that, Correlates of War National Material Capabilities data for 2022 record 1,280,000 active personnel — a mobilization level that stands out as the single most striking number in the file. The same 2022 COW data give a CINC score of 0.014094, or about 1.4 percent of global material capability, as CINC is expressed as a share of the world total.
The FAS Nuclear Notebook puts the North Korean warhead inventory at 50 as of 2025. That is the most recent observation in the dataset and the only nuclear datapoint supplied.
Military spending is recorded once, at $1.60 billion, and that figure is from 2018 per SIPRI. No later observation is available, so the trajectory of defense outlays over the past seven years cannot be established here.
V-Dem v15 scores for 2025 are at the floor of each index, which runs from 0 to 1: electoral democracy 0.083, liberal democracy 0.014 and state capacity 0.033.
Our World in Data records primary energy consumption of 0.6642 exajoules in 2023 and electricity generation of 27.1 TWh in 2024. Both oil and gas production are recorded at zero, but those entries date from 2016 and should not be read as current.
What is missing
No GDP, GDP per capita, government debt or foreign reserves figure is supplied for North Korea. That gap matters: without output data, the 2018 SIPRI spending figure cannot be expressed as a share of the economy, and no defense burden can be stated. Nor can the cost of sustaining 1.28 million personnel be set against national resources.
Also absent: trade, arms transfers, conflict events and casualty data. Analysts needing an economic denominator for North Korea will not find one here, and this briefing does not substitute an estimate for it.
Sources: World Bank WDI; SIPRI Military Expenditure Database; Correlates of War National Material Capabilities; FAS Nuclear Notebook; V-Dem v15; Our World in Data (Energy).
Written from the sourced figures on this page and checked against them before publication — any figure not present in the data blocks the briefing. Generated 2026-10-06.
What drives the instability score
Capability and economy · click a metric to compare
CINC is a composite index (already contains military spending, personnel, energy & population) — shown for reference; it is not added into the Composite Power Index to avoid double-counting. Each figure carries its own source year; vintages can differ.
Capability profile
Trajectory
Governance
Energy
Strategic Relationships
Allies (3)
- Chinadefense 1961
- Russiaentente 2000
- South Koreanonaggression 1991
COW alliance ties — includes historical pacts; defense first.
Neighbours (4)
Disputes (91)
COW Dyadic MID, 1816–2014 — historical register, not live rivalries. Count = militarized disputes; year = most recent; ● = peak intensity.
- South Korea31× · 2014
- United States24× · 2014
- Japan9× · 2013
- Panama1× · 2013
- China6× · 2010
- Spain1× · 2002
- Canada2× · 1994
- Australia2× · 1994
- France2× · 1990
- Taiwan1× · 1955
- South Africa1× · 1953
- Türkiye1× · 1953
Signals
Conflict forecast (ViEWS, 2029-04-01): 0% risk
Arms imports (SIPRI Arms Transfers, 2010): 1 transfers
Displacement (UNHCR): 263 refugees originated · 0 IDPs ·
Compare North Korea with
 China
 Japan
 South Korea
 Russia
 United States
Neighbours and leading powers — each links to its own sourced dossier.