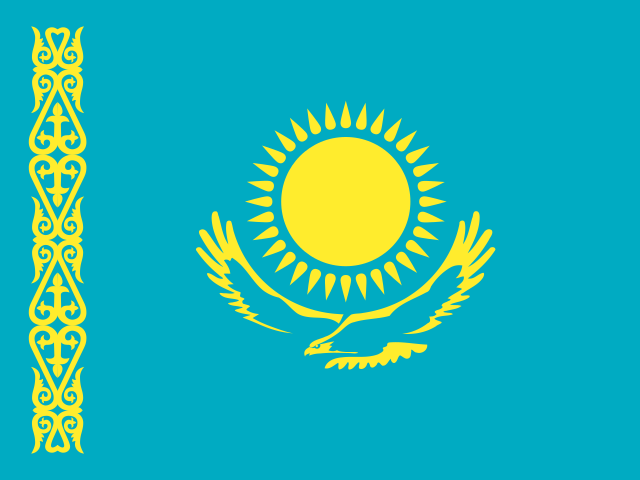
 Kazakhstan
 ranks #69 of 242 on the Composite Power Index (1.1/100), scored on military spending, active personnel, nuclear arsenal, economic size and logistics. Its Instability Index is 31.4/100 (#68 most fragile). Every figure below carries its source and year. Data read 2026-10-22.
Analyst briefing
Kazakhstan: Substantial Hydrocarbon Output Against Low Governance Scores
Kazakhstan's GDP reached $291.48 billion in 2024, per the World Bank's World Development Indicators, with GDP per capita of $14,155 the same year and a population of 20.59 million. Government debt is comparatively low, at 24.9 percent of GDP for 2026 per the IMF's World Economic Outlook, and reserves stood at $18.18 billion in 2025 according to IMF International Financial Statistics.
Defense spending is modest relative to the size of the economy. SIPRI's 2025 military expenditure data puts outlay at roughly $1.31 billion, or 0.43 percent of GDP on SIPRI's own GDP series — a figure that should not be checked against the World Bank's $291.48 billion GDP estimate above, since the two series are calculated independently. The Correlates of War National Material Capabilities (NMC) dataset lists 39,000 active personnel as of 2022 and a composite index of national capability (CINC) of 0.0027 for that year.
Governance indicators are low. V-Dem's 2025 data (v15) scores Kazakhstan at 0.259 on electoral democracy, 0.131 on liberal democracy, and 0.217 on state capacity — among the lower state-capacity readings in this dataset despite the country's substantial hydrocarbon wealth.
Energy figures are current and notably large for the country's population. Our World in Data's energy series lists primary energy consumption of 3.104 exajoules in 2024 and electricity generation of 123.69 terawatt-hours in 2025. Oil production stood at 1,018.3 terawatt-hours and gas production at 297.3 terawatt-hours, both for 2024 — unlike several other countries in this set, Kazakhstan's production figures are current rather than a decade stale.
Data gaps
No gaps of the kind flagged elsewhere in this set — all energy figures here are dated 2024-2025, not 2016, which stands out against several neighboring entries in this country list where production data stops a decade earlier. No arms-trade, nuclear, or alliance-commitment data appears in this bundle. The SIPRI milex-to-GDP ratio is calculated on SIPRI's internal GDP series, not the World Bank's $291.48 billion WDI figure cited above, and the two should not be divided against each other to check the arithmetic.
Sources: World Bank WDI, IMF WEO, IMF IFS, SIPRI Milex, COW NMC, V-Dem v15, Our World in Data (Energy).
Written from the sourced figures on this page and checked against them before publication — any figure not present in the data blocks the briefing. Generated 2026-10-06.
What drives the instability score
Capability and economy · click a metric to compare
CINC is a composite index (already contains military spending, personnel, energy & population) — shown for reference; it is not added into the Composite Power Index to avoid double-counting. Each figure carries its own source year; vintages can differ.
Capability profile
Trajectory
Governance
Energy
Strategic Relationships
Allies (12)
- Moldovadefense 1995
- Turkmenistandefense 1995
- Ukrainedefense 1995
- Armeniadefense 1995
- Azerbaijandefense 1995
- Belarusdefense 1995
- Georgiadefense 1995
- Uzbekistannonaggression 2001
- Kyrgyzstannonaggression 1996
- Russianonaggression 1996
- Tajikistannonaggression 1996
- Chinanonaggression 1996
COW alliance ties — includes historical pacts; defense first.
Disputes (3)
COW Dyadic MID, 1816–2014 — historical register, not live rivalries. Count = militarized disputes; year = most recent; ● = peak intensity.
- Russia1× · 2013
- Bulgaria1× · 1996
- Afghanistan1× · 1993
Signals
Conflict forecast (ViEWS, 2029-04-01): 0% risk
Arms imports (SIPRI Arms Transfers, 2025): 1 transfers
42% of imports from Russia — supplier dependence
Displacement (UNHCR): 4.1K refugees originated · 0 IDPs · 4.4K hosted
Compare Kazakhstan with
 Azerbaijan
 China
 Iran
 Kyrgyzstan
 Russia
Neighbours and leading powers — each links to its own sourced dossier.