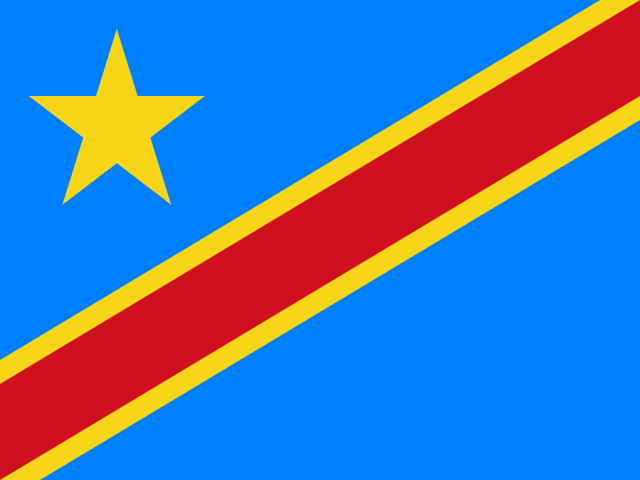
 DR Congo
 ranks #55 of 242 on the Composite Power Index (1.7/100), scored on military spending, active personnel, nuclear arsenal, economic size and logistics. Its Instability Index is 91.4/100 (#3 most fragile). Every figure below carries its source and year. Data read 2026-10-22.
Analyst briefing
DR Congo: Low Per Capita Output and Weak State Capacity
The Democratic Republic of the Congo's GDP was $71.0 billion in 2024, with per capita output of just $649 across a population of 109.3 million, per the World Bank's WDI figures for that year — a large population set against a very low per capita income figure.
Fiscal and External Position
The IMF's WEO projects government debt at 24.6 percent of GDP in 2026, a forward estimate rather than an actual outturn. Reserves stood at $5.1 billion as of 2023, per World Bank WDI data — a figure two years older than the rest of this profile and a thin buffer against a population of over 109 million.
Military Posture
SIPRI's 2025 figures put military expenditure at $1.23 billion, or 1.375 percent of GDP. That ratio is calculated against SIPRI's own GDP series, not the WDI figure cited above, and the two should not be combined. Active personnel numbered 134,000 as of 2022, per COW NMC, with a CINC score of 0.0059 in the same release. Both figures predate the 2025 spending data by three years and say nothing about force levels amid any current fighting.
Governance
V-Dem's 2025 data gives DR Congo an electoral democracy index of 0.306 and a liberal democracy index of 0.115 — low readings — alongside a state capacity score of 0.108 — a very low reading on V-Dem's 0-1 scale under the v15 methodology.
Energy
Primary energy consumption was 0.1457 exajoules in 2023, and electricity generation reached 15.92 TWh in 2024, per Our World in Data — a small generation base set against a population of over 109 million. Oil production of 12.623 TWh is dated to 2016, nine years stale, and gas production is recorded as 0.0 TWh for the same year. Neither figure describes current output.
What the Data Does Not Show
This profile contains no figures on the armed conflict in the eastern provinces, UN peacekeeping presence, mineral-sector revenue, or foreign troop involvement — all materially relevant to assessing DR Congo's security situation but absent from the supplied facts. The reserves figure is from 2023 and the energy-production figures from 2016; neither should be treated as describing conditions today.
Sources: World Bank WDI, IMF WEO, SIPRI Milex, COW NMC, V-Dem v15, Our World in Data (Energy)
Written from the sourced figures on this page and checked against them before publication — any figure not present in the data blocks the briefing. Generated 2026-10-06.
What drives the instability score
Capability and economy · click a metric to compare
CINC is a composite index (already contains military spending, personnel, energy & population) — shown for reference; it is not added into the Composite Power Index to avoid double-counting. Each figure carries its own source year; vintages can differ.
Capability profile
Trajectory
Governance
Energy
Strategic Relationships
Allies (15)
- Congo Republicdefense 2006
- Kenyadefense 2006
- Rwandadefense 2006
- Sudandefense 2006
- Tanzaniadefense 2006
- Ugandadefense 2006
- Zambiadefense 2006
- Angoladefense 2006
- Burundidefense 2006
- Central African Republicdefense 2006
- Gabondefense 2000
- Equatorial Guineadefense 2000
- Sao Tome and Principedefense 2000
- Chaddefense 2000
COW alliance ties — includes historical pacts; defense first.
Neighbours (10)
Disputes (55)
COW Dyadic MID, 1816–2014 — historical register, not live rivalries. Count = militarized disputes; year = most recent; ● = peak intensity.
- Rwanda9× · 2014
- Uganda10× · 2013
- South Sudan1× · 2013
- Angola7× · 2009
- Burundi2× · 2007
- Zambia7× · 2004
- Libya2× · 2002
- Congo Republic7× · 1997
- Belgium3× · 1993
- France1× · 1991
- Cuba2× · 1978
- South Africa1× · 1977
Signals
Conflict forecast (ViEWS, 2029-04-01): 100% risk
Arms imports (SIPRI Arms Transfers, 2024): 4 transfers
44% of imports from South Africa — supplier dependence
Displacement (UNHCR): 1.2M refugees originated · 5.7M IDPs · 503.7K hosted
Compare DR Congo with
 Angola
 Burundi
 Central African Republic
 Congo Republic
 Rwanda
Neighbours and leading powers — each links to its own sourced dossier.