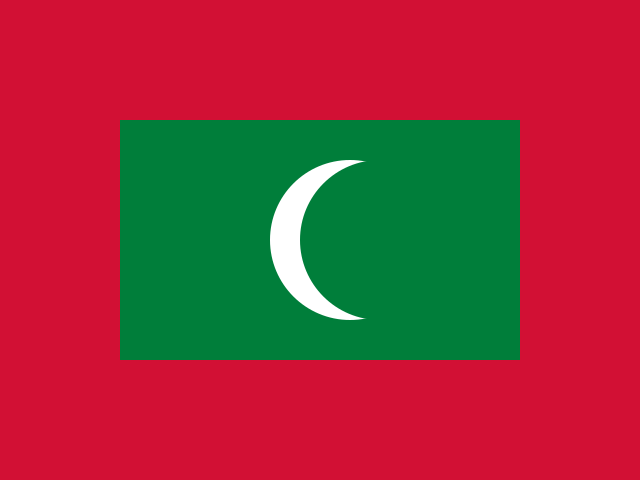
 Maldives
 ranks #173 of 242 on the Composite Power Index (0.1/100), scored on military spending, active personnel, nuclear arsenal, economic size and logistics. Its Instability Index is 13/100 (#174 most fragile). Every figure below carries its source and year. Data read 2026-10-22.
Analyst briefing
Maldives
Economic Position
Maldives posted gross domestic product of about $7.06 billion in 2024, per World Bank WDI, with GDP per capita of roughly $13,379 the same year — among the higher per-capita figures in this dataset. Population was 527,799 in 2024, per World Bank WDI. Government debt is a standout figure: the IMF WEO puts it at 129.4% of GDP for 2026. Reserves were approximately $674 million in 2024, per World Bank WDI.
Governance
V-Dem v15's 2025 data gives Maldives an electoral democracy index of 0.556 and a liberal democracy index of 0.416, both in the middle range of the index's scale. State capacity is scored higher, at 0.763, for the same year.
Military and Power Indicators
The Correlates of War National Material Capabilities dataset records zero active military personnel for Maldives in 2022, with a composite index of national capability (CINC) of 3.1270771e-05 for the same year. No SIPRI military-expenditure data appears in this bundle.
Energy
Primary energy consumption was 0.0282 exajoules in 2023, per Our World in Data. Electricity generation was 0.85 terawatt-hours in 2024, per the same source. Oil and gas production were both 0.0 terawatt-hours in 2016, per Our World in Data, consistent with an economy without recorded domestic hydrocarbon output in that series.
Data Gaps
No SIPRI milex figures are present, so defense spending cannot be stated in dollars or as a share of GDP. The oil and gas production series dates to 2016, well behind the 2023-2024 energy figures elsewhere in this bundle, and should not be read as current. The debt figure of 129.4% of GDP is the single most notable data point here and is carried as an IMF WEO 2026 projection rather than an outturn; no prior-year debt figure is available in this bundle for comparison.
Sources: World Bank WDI, IMF WEO, Correlates of War National Material Capabilities, V-Dem v15, Our World in Data (Energy).
Written from the sourced figures on this page and checked against them before publication — any figure not present in the data blocks the briefing. Generated 2026-10-06.
What drives the instability score
Capability and economy · click a metric to compare
CINC is a composite index (already contains military spending, personnel, energy & population) — shown for reference; it is not added into the Composite Power Index to avoid double-counting. Each figure carries its own source year; vintages can differ.
Capability profile
Trajectory
Governance
Energy
Strategic Relationships
Allies (0)
No alliance data loaded.
Neighbours (1)
Disputes (0)
COW Dyadic MID, 1816–2014 — historical register, not live rivalries. Count = militarized disputes; year = most recent; ● = peak intensity.
No militarized disputes recorded (COW MID).
Signals
Conflict forecast (ViEWS, 2029-04-01): 0% risk
Arms imports (SIPRI Arms Transfers, 2025): 3 transfers
40% of imports from Türkiye — supplier dependence
Displacement (UNHCR): 62 refugees originated · 0 IDPs ·
Compare Maldives with
 India
 United States
 China
 Russia
 North Korea
Neighbours and leading powers — each links to its own sourced dossier.