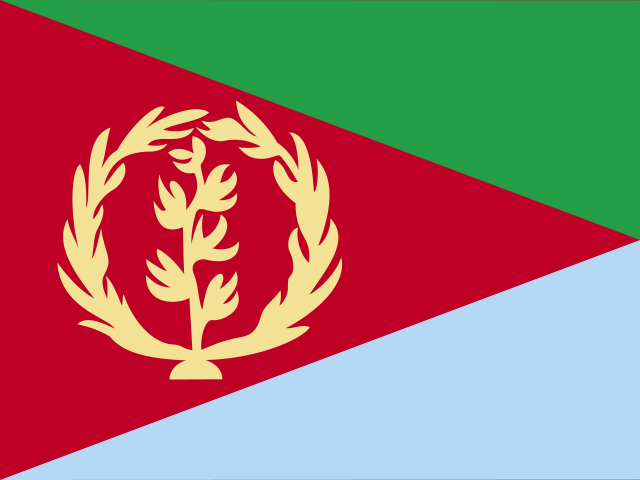
 Eritrea
 ranks #34 of 242 on the Composite Power Index (3.0/100), scored on military spending, active personnel, nuclear arsenal, economic size and logistics. Its Instability Index is 42.6/100 (#36 most fragile). Every figure below carries its source and year. Data read 2026-10-22.
Analyst briefing
Eritrea: Sparse and Dated Data Across Most Indicators
Data on Eritrea in this dataset are thin and, in several cases, old enough that they describe a different period of the country's history rather than its present condition. This briefing is strictly descriptive and draws no inference beyond what each figure, on its own, supports.
Economy
The World Bank's WDI figures put Eritrea's GDP at $2.07 billion and GDP per capita at $689 — both dated to 2011. These figures say nothing about Eritrea's current economic output. Population is more current, at 3,535,603 for 2024, also World Bank WDI.
Debt and Reserves
The IMF's WEO figures show government debt at 260.4% of GDP, dated 2019. The World Bank's WDI data put reserves at $191.7 million, also for 2019. Neither figure reflects conditions after that year.
Military
SIPRI's figures for Eritrean military expenditure — $181.6 million, equivalent to 20.866% of GDP under SIPRI's own GDP series — date to 2003, more than two decades old. This milex-to-GDP ratio uses SIPRI's own GDP series from that year, not the World Bank GDP figure above, and the two should not be mixed even if they were contemporaneous, which they are not. The COW NMC dataset lists 302,000 active personnel in 2022 and a CINC score of 0.0031 for the same year — the only military-related figures here closer to the present.
Governance
V-Dem's 2025 (v15) scores are current: electoral democracy at 0.069, liberal democracy at 0.009, and state capacity at 0.064 — among the lowest scores in each category that V-Dem tracks globally.
Energy
Per Our World in Data, primary energy consumption was 0.0109 exajoules in 2023 and electricity generation was 0.45 terawatt-hours in 2024 — both figures indicating a very small energy sector in absolute terms. Oil and gas production are both listed at 0.0 TWh, dated 2016.
Sources: World Bank WDI; IMF WEO; SIPRI Milex; COW NMC; V-Dem v15; Our World in Data (Energy).
Written from the sourced figures on this page and checked against them before publication — any figure not present in the data blocks the briefing. Generated 2026-10-06.
What drives the instability score
Capability and economy · click a metric to compare
CINC is a composite index (already contains military spending, personnel, energy & population) — shown for reference; it is not added into the Composite Power Index to avoid double-counting. Each figure carries its own source year; vintages can differ.
Capability profile
Trajectory
Governance
Energy
Strategic Relationships
Neighbours (5)
Signals
Conflict forecast (ViEWS, 2029-04-01): 0% risk
Arms imports (SIPRI Arms Transfers, 2007): 1 transfers
Displacement (UNHCR): 554.9K refugees originated · 0 IDPs · 119 hosted
 Djibouti
 Ethiopia
 Saudi Arabia
 Sudan
 Yemen